
Spring 2023 Groundwater Levels in YCFCWCD Service Area
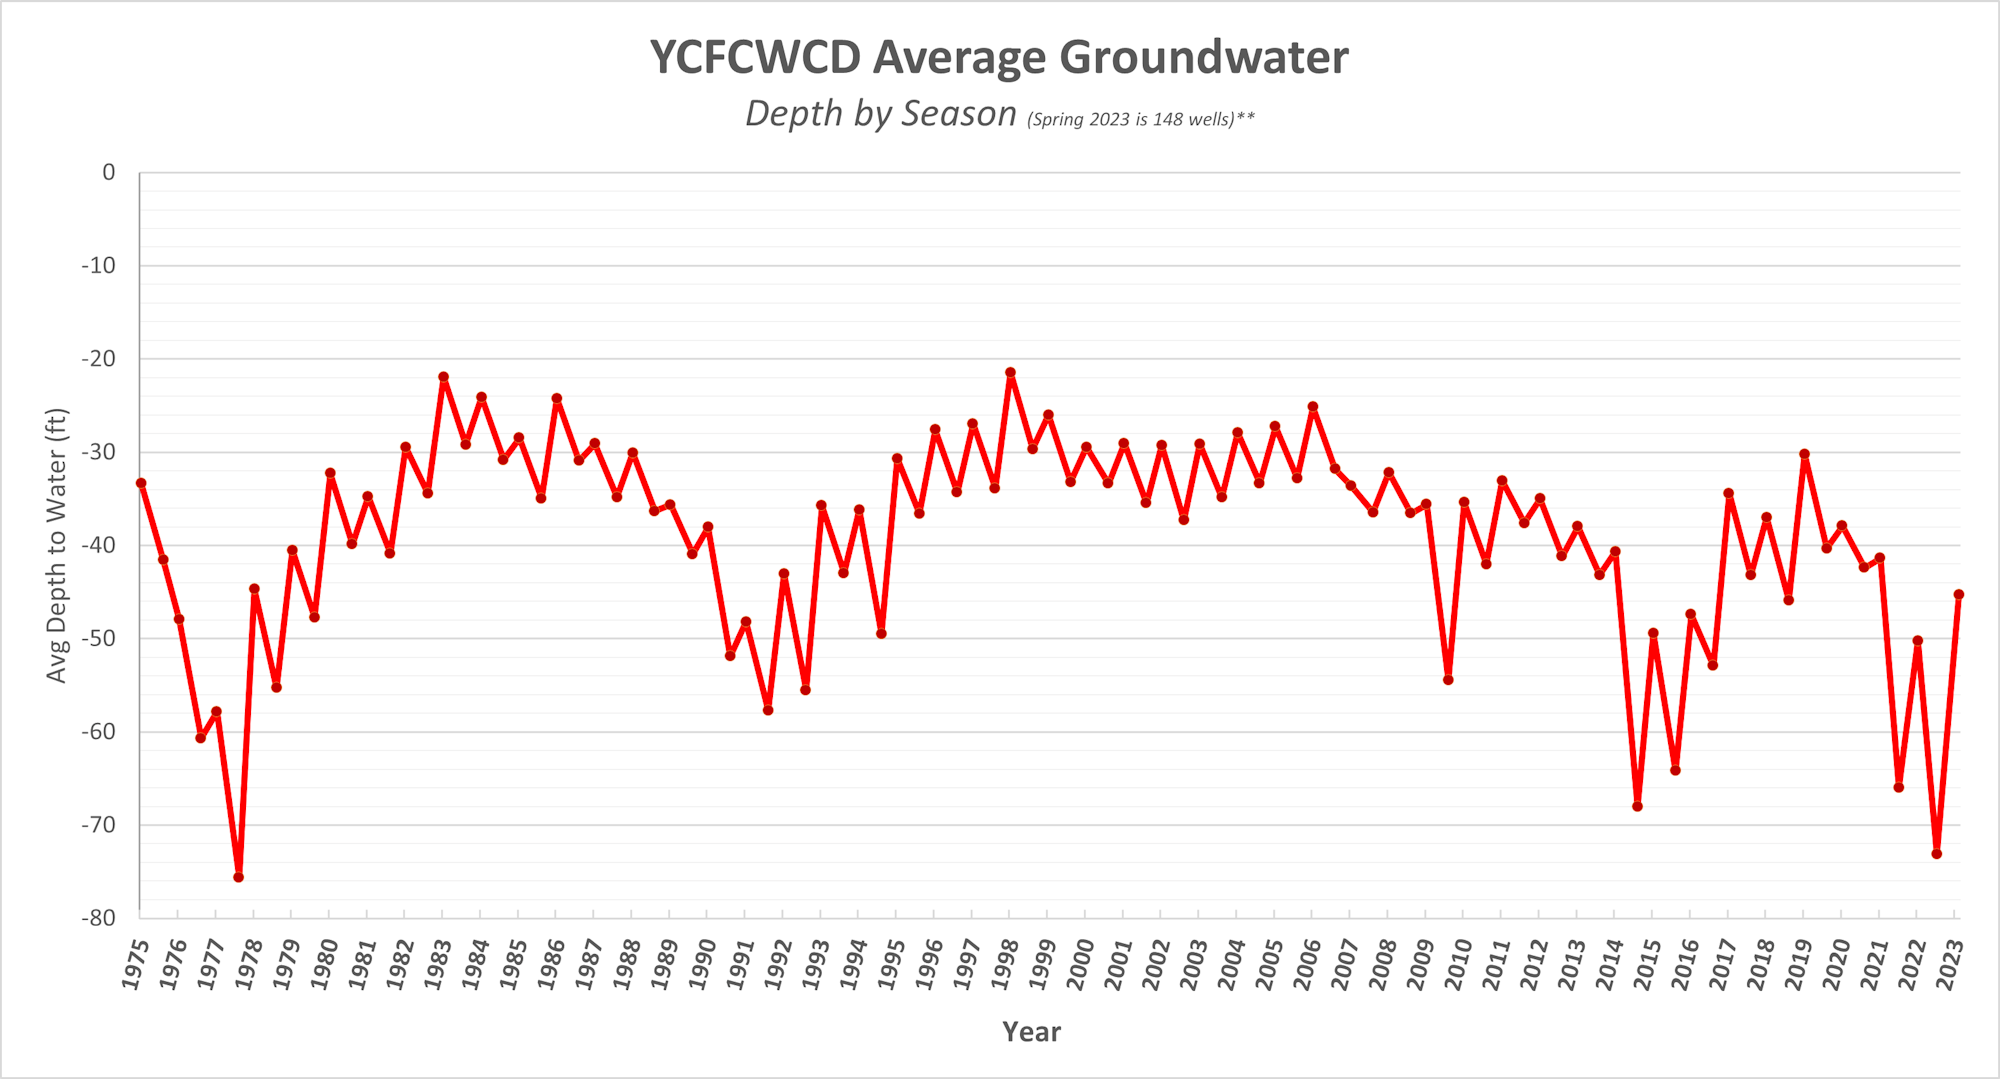
Groundwater levels are measured in the YCFCWCD's 160-well network each spring and fall. The graph above shows the average groundwater level of the wells with long periods-of-record. After a sharp decline in fall 2022 caused by an exceptionally dry winter and spring that prevented the district from providing any surface water for irrigation, this spring's groundwater levels showed the second-largest recovery on record, just behind that of spring 1978.