
Fall 2020 Groundwater Levels in the YCFCWCD Service Area
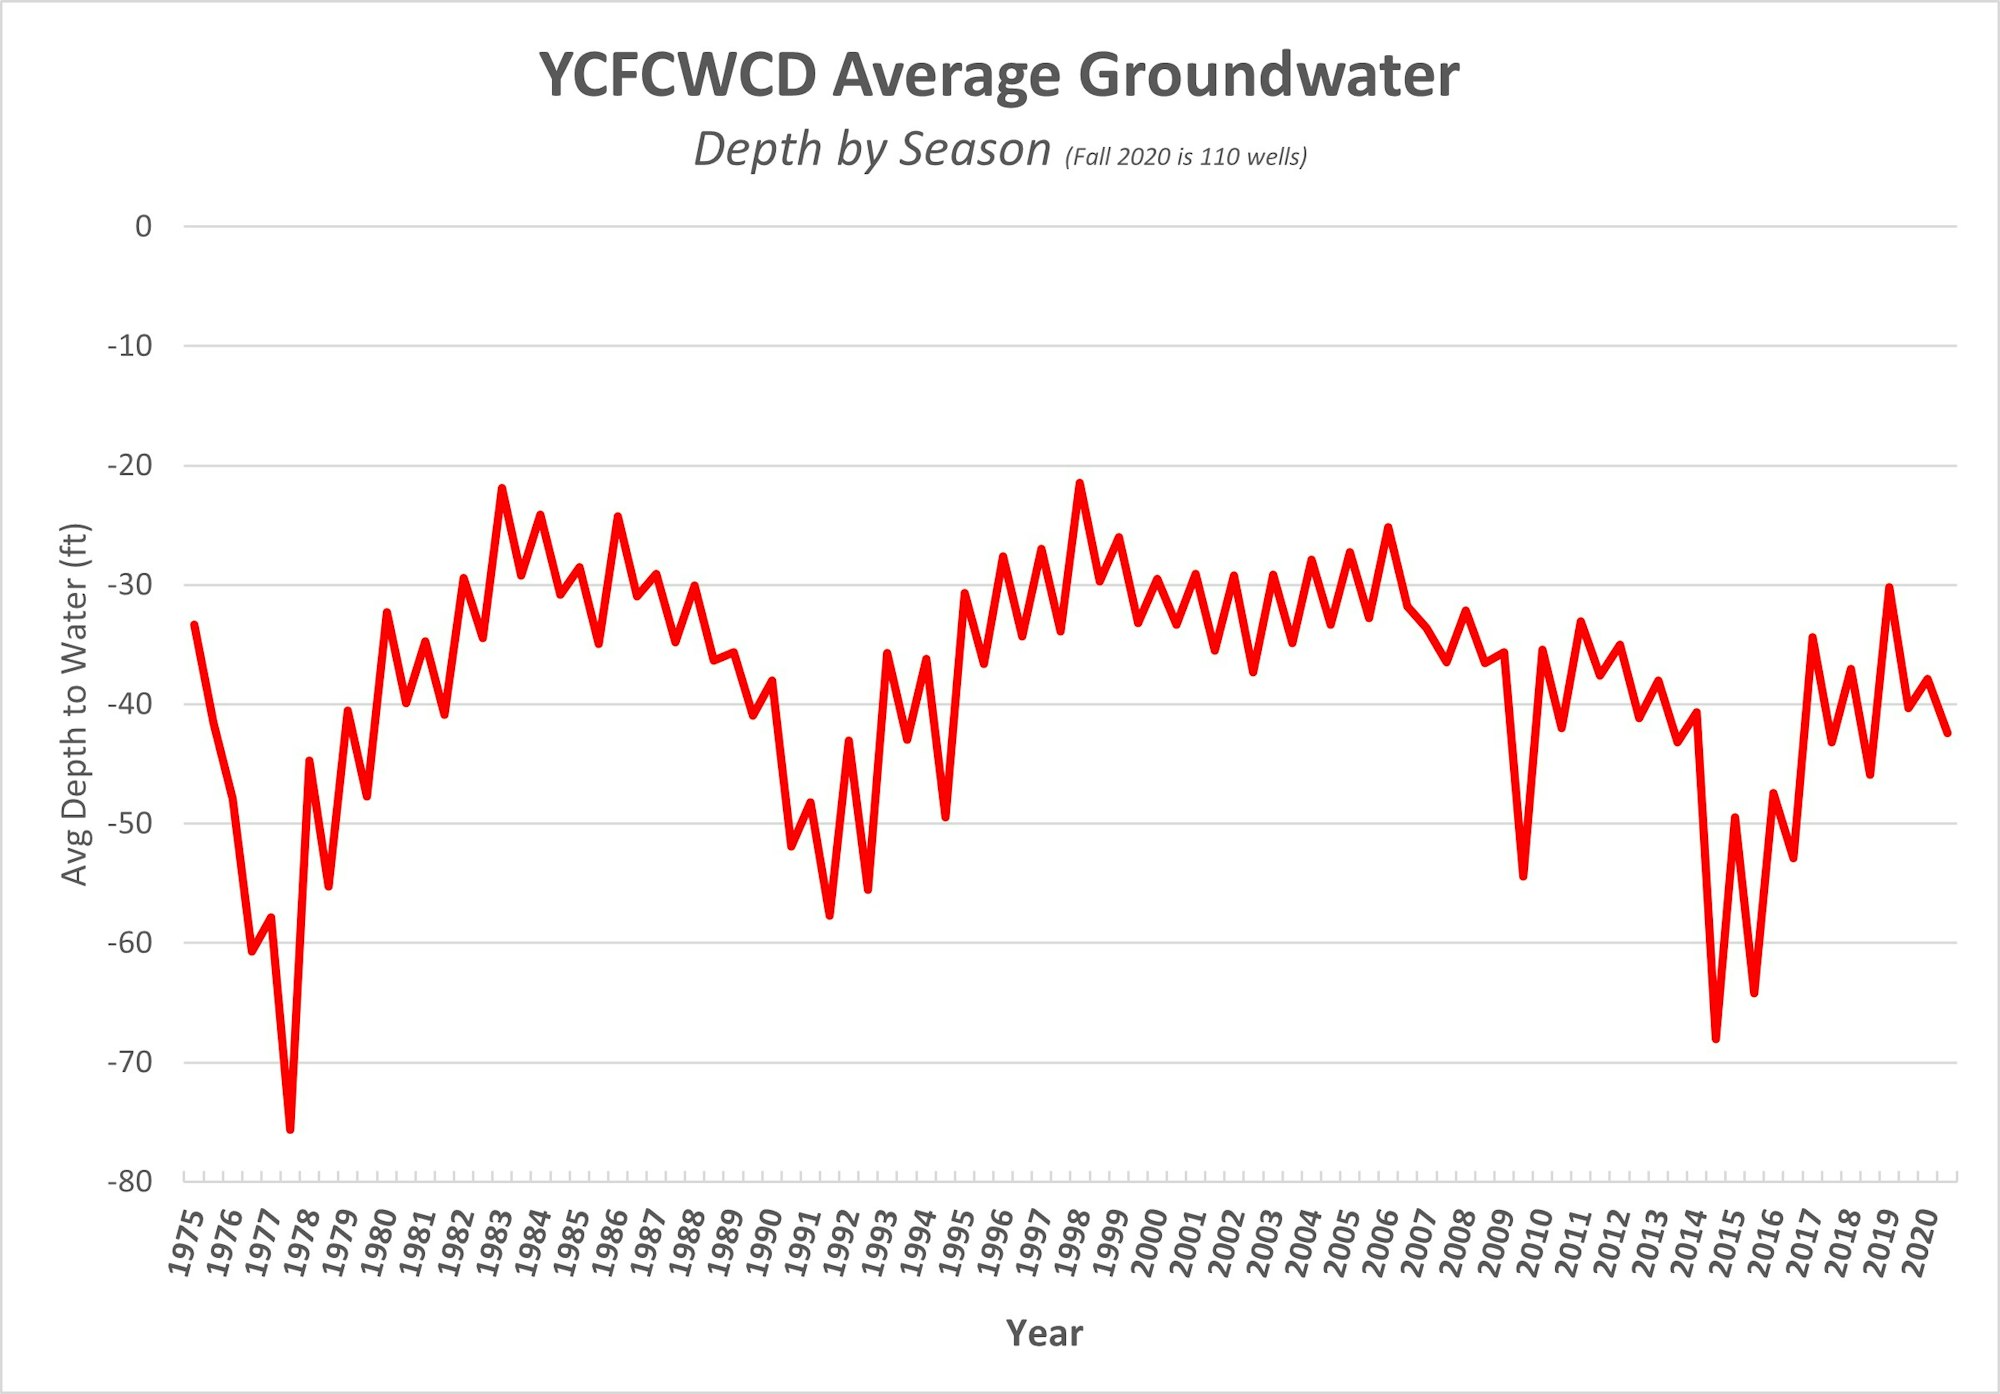
Groundwater levels are measured in the YCFCWCD 150 well network each spring and fall. The graph above show the average groundwater level of all the wells. This fall's 2020 levels dropped, as expected, after a long summer with no rain.