
Fall 2018 Groundwater Levels in the YCFCWCD Service Area
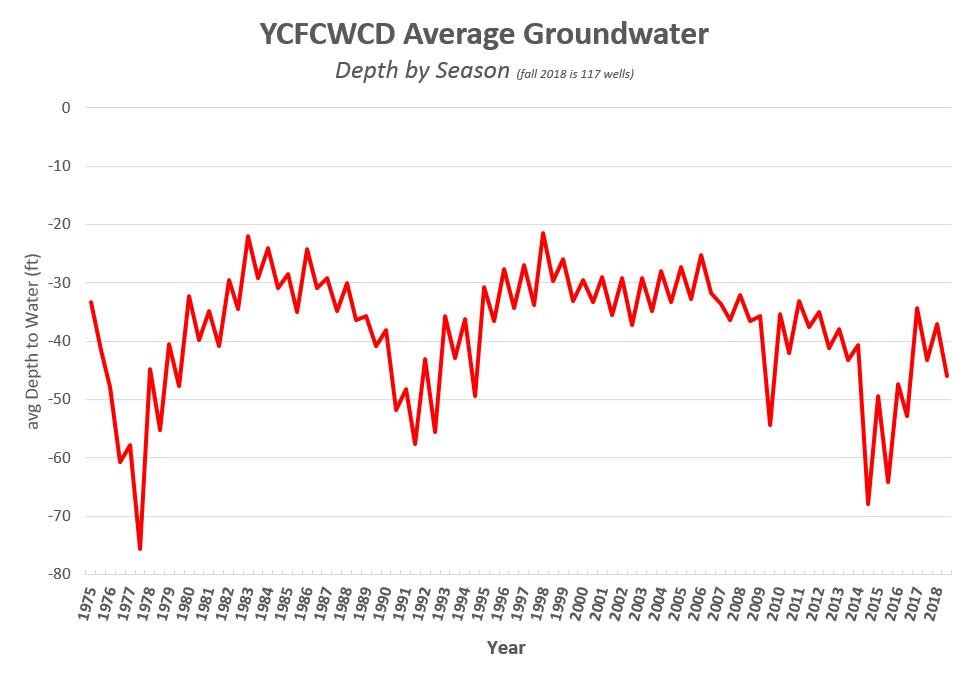
Groundwater levels are measured in the YCFCWCD 150 well network each spring and fall. The graph above show the average groundwater level of all the wells. This fall’s 2018 levels dropped, as expected each fall. In the spring, they will recover again. Hence the saw-tooth pattern seen in the hydrograph. In the short term, the amount of drop or recovery depends on the winter rains. If there is more rain, there is less drop and more recovery. If it is dry, groundwater levels drop more and recover less. In the long term, increased pumping from wells can overcome recharge rates and levels could fall year after year, a situation called overdraft. The activities of the YSGA hope to avoid overdraft.